So one of the tasks for the project I'm on is to update a report with some additional data. It's a report showing a list of people and what they did when they heard a certain song (let it play vs skip it). The task was to add another detail report that would pop up when you clicked on one line and show the trend of listening vs skipping the song (and how long the song played before you took action). The example was something like this:
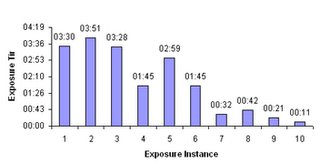
Besides being confused by this graph initially, and thinking the thing is pretty darn ugly; I know better than to do this (and its all Don Park's fault).
Besides pointing me at tiny databases, new languages, and a whole assortment of other DHTML goodies; he discovered an article by Edward Tufte on a new concept for graphs that are so tiny, they can be placed within the text itself, allowing small bits of data to accompany the text without breaking the flow of reading. He called these things sparklines.
They're a neat idea, and they've gotten fair interest in the free software community. There's various libraries for generating all kinds of line and bar graphs. I like this one that shows the  federal deficit (those black bars are when there was a democrat in office :-). But for what I was doing, trying to jam in a big client side library of javascript or trying to get all the customer servers to add more server side libraries seemed to be overkill.
I thought there ought to be some way of doing it with DIVs, but browsing around just a bit I ran into a bunch of examples that just used tables. With a little bit of experimentation I managed to come up with this:
| |
|
|
|
|
|
|
|
|
|
<TABLE bgcolor=white  cellSpacing=1 cellPadding=0>
<TR valign=bottom>
  <TD height=20> <TABLE border=0 cellSpacing=0 cellPadding=0 width=2><TR><TD height=13 bgcolor=blue></TD></TR></TABLE> </TD>
  <TD> <TABLE border=0 cellSpacing=0 cellPadding=0 width=2><TR><TD height=14 bgcolor=blue></TD></TR></TABLE> </TD>
  <TD> <TABLE border=0 cellSpacing=0 cellPadding=0 width=2><TR><TD height=13 bgcolor=blue></TD></TR></TABLE> </TD>
  <TD> <TABLE border=0 cellSpacing=0 cellPadding=0 width=2><TR><TD height=6 bgcolor=red></TD></TR></TABLE> </TD>
  <TD> <TABLE border=0 cellSpacing=0 cellPadding=0 width=2><TR><TD height=10 bgcolor=blue></TD></TR></TABLE> </TD>
  <TD> <TABLE border=0 cellSpacing=0 cellPadding=0 width=2><TR><TD height=6 bgcolor=red></TD></TR></TABLE> </TD>
  <TD> <TABLE border=0 cellSpacing=0 cellPadding=0 width=2><TR><TD height=2 bgcolor=red></TD></TR></TABLE> </TD>
  <TD> <TABLE border=0 cellSpacing=0 cellPadding=0 width=2><TR><TD height=3 bgcolor=red></TD></TR></TABLE> </TD>
  <TD> <TABLE border=0 cellSpacing=0 cellPadding=0 width=2><TR><TD height=1 bgcolor=red></TD></TR></TABLE> </TD>
  <TD> <TABLE border=0 cellSpacing=0 cellPadding=0 width=2><TR><TD height=1 bgcolor=red></TD></TR></TABLE> </TD>
</TR>
</TABLE>
Conveys just about as much data (the actual number of seconds is not really important--this is about trends), and its small enough to fit right in the original table instead of needing a separate window. I think I'll just tell the client it was my idea ...
